On Jan. 19, industrial and commercial market intelligence firm SalesLeads’ released its annual review of total capital project activity in the North American food & beverage sector for 2020, and the data showed a year that was overall down from 2019 but ended strongly.
Covering facility expansions, new plant construction and significant equipment modernization projects, SalesLeads' annual report confirmed 872 new such food & beverage projects in 2020, down 9 percent from 2019. Only four months in 2020 — July, September, November and December — had more activity than in 2019 as the COVID-19 pandemic had an immense impact on capital spending plans across the entire manufacturing sector.
 SalesLeads
The largest year-over-year declines were from February through June as many food & beverage manufacturers reacted to the early stages of the pandemic by either slashing capital spending plans or delaying them.
Here's the breakdown of those 872 projects in 2020, according to SalesLeads:
Food & Beverage Project Type
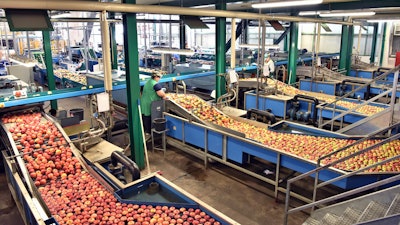
- Processing Facilities - 631
- Distribution and Industrial Warehouse - 287
Food & Beverage Project Scope/Activity
- New Construction - 273
- Expansion - 248
- Renovations/Equipment Upgrades - 377
- Plant Closing - 25
Food & Beverage Project Location (Top 10 States)
- Texas - 57
- California - 54
- New York - 47
- Ohio - 44
- Florida - 31
- Pennsylvania - 31
- Georgia - 31
- North Carolina - 31
- Indiana - 29
- Illinois - 28
Year-Over-Year Growth by State
SalesLeads' research showed that North Carolina had the highest increase of projects tracked, with 26 percent more projects identified than in 2019. Conversely, California showed the largest decline of projects tracked, with a 48 percent decline compared to 2019.
Most Active Month
The data showed that the most active month was January, where 89 new projects opportunities were identified.
Largest Month-to-Month Increase in Projects Tracked
SalesLeads' research showed that there was a 23 percent increase in new projects tracked from October 2020 to November 2020. Conversely, May-June showed the largest month to month decline; with 86 new projects in May and 73 in June.
Opportunities - By Equipment Need
Getting more granular, SalesLeads' research also tracked what equipment was likely to be required by these various food & beverage capital spending projects throughout 2020. Here's what would be needed most across those 872 new projects:
- Air Emissions Control Equipment - 572
- Compressed Air Systems - 728
- Control Systems and Instrumentation - 544
- Conveyors - 687
- Floor Coatings - 451
- Material Handling/Storage Equipment - 768
- Mechanical Construction - 685
- Packaging Equipment - 545
- Process Equipment - 540
- Tanks/Vessels - 348
Largest Planned Project
During the year 2020, SalesLeads identified 28 new food & beverage facility construction projects with an estimated value of $100 million of more.
The largest project is owned by Nestle Purina Petcare, which is plans to invest $550 million for an expansion of their processing facility in Hartwell, GA.