When I was younger, I loved to watch a cartoon on TV called ‘The Jetsons,’ which showed life in a future world. People had flying, self-driven “cars” and robotic housekeepers. As a kid who loved her meat and potatoes, I distinctly remember one scene in which Judy Jetson served a steak dinner by getting a pill from a vending-type machine. Her father, George Jetson, savored the two small bites filled with flavor and nutrition. This meal satisfied him completely. I couldn’t then imagine that futuristic dinner scene being a reality, and I still don’t. But technology, science, and marketing have changed the way we produce our food and have altered the structure of farming. Data tell us so. Let’s look at milk as an example.
 iStock
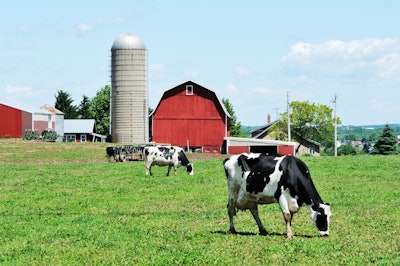
Eighty-three years later, the National Agricultural Statistics Service (NASS), which conducts the Census of Agriculture today, documented in the 2017 Census of Agriculture that there were 2.0 million farms on 900 million acres with an average size of 441 acres. In 2017, 54,599 farms had 9.5 million milk cows. A separate milk production report published by NASS showed that 8.7 million cows in the top 23 milk producing states produced 202.5 billion pounds of milk or 23.5 billion gallons in 2017. That’s 72 gallons a year for each of the 327 million people in the United States. Each cow produced about 2,695 gallons per year or about 7.4 gallons per cow each day. Milk is used for making cheese, butter, ice cream, and yogurt in addition to drinking milk and other dairy products.
According to the International Dairy Foods Association, National Dairy Month started out as National Milk Month in 1937 as a way to promote drinking milk. It was initially created to stabilize the dairy demand when production was at a surplus.
While we can supplement our nutrition in a pill, we still rely on actual agriculture for our food. Thanks to agricultural innovations, we have seen remarkable increases in production efficiency to feed a growing global population.
Sue King is Public Affairs Director for the USDA's National Agricultural Statistics Service in Research and Science.


